....GEOSPATIAL 101 – UNDERSTANDING LOCATION BASED TECHNOLOGY ..GEOSPATIAL - ENTENDENDO A TECNOLOGIA BASEADA NA LOCALIZAÇÃO....

Welcome to Geospatial 101. In this collection of brief learning modules, you will learn the fundamentals of geospatial analysis. This includes defining what geospatial is, learning the functions and composition of electronic maps, and how GIS ties everything together. Get ready to view our world in a whole new way. Enjoy!
WHY GEOSPATIAL?
Everything happens somewhere and 80% of data has a location component to it…the questions are unlimited, visualizing the answers is powerful. Layering data associated with physical location provides leaders a clear and in-depth insights that can empower strategic decision, drive revenue, and improve processes.
WHAT IS GEO?
Geo- is simply a prefix meaning “of or relating to the earth”. Like “this section will improve your geo-literacy.”
WHAT IS SPATIAL?
Spatial is an adjective meaning “of or relating to space.” Spatial analysis involves looking at where entities are in relation to one another, the space between them, and the characteristics of that space.
WHAT IS GEOSPATIAL?
Bringing it all together, we get a super adjective that means “relating to or denoting data that is associated with a particular location.” So if something has a location component, it’s geospatial.
WHAT’S DIGITAL MAP?
A map is a representation of an area, showing physical features and their spatial relationships. A digital map is a virtual map shared and displayed through computer systems. It is the visualization tool for geospatial data.
COMPONENTS
Digital maps consist of four components: a base image, features, layers, and symbols
BASE IMAGE
The base image is the canvas on which a map is displayed. It can range from a general outline of the area to a high-resolution satellite image.
FEATURES
Features are components of the earth and can be either natural or artificial. Artificial features are human-made and include roads, buildings, monuments, while natural features are inherent to the earth, and include mountains, lakes, and rivers.
LAYERS
Layers are how you display data on a map. Layers hold a subset or a particular view of your data, and you can specify the color, symbols, and any other presentation component to display the data in the most effective way. These layers can be toggled, moved, and customized with a digital map.
SYMBOLS
Symbols, simply put, are something that stands for something else on a map. Like a picture of a pump to represent a gas station or a tree to represent a park. Choosing clear and semantic symbols is imperative to creating an effective map.
EXAMPLE
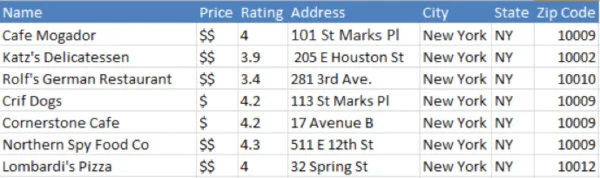
I love to eat out, so I made an excel table of my favorite restaurants in New York City. In the columns, I included the name, rating, prices, and address of each restaurant. Sounds like geospatial data to me! But now what do I do with it? Can I visualize this data in a bar chart? (If you think you can, you’re either missing the point or are a graphical genius)
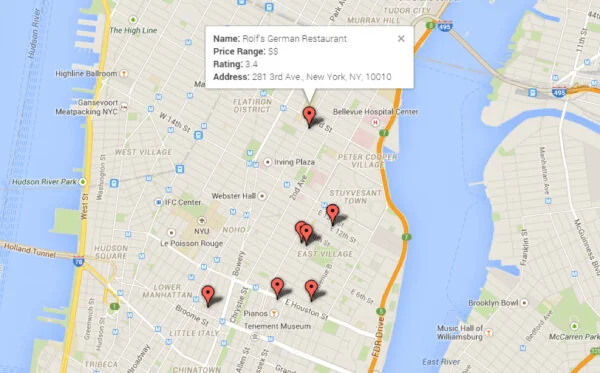
I can plot these restaurants on a map! We have a street map of New York City as the base image, which depicts features such as NYU and Bellevue Hospital Center. I have my restaurant names, prices, and rating in a layer, along with their latitude and longitude. The lat/long determines where the restaurant is on the base map, and we’ll cover how we went from textual address to lat/long in the next section. Finally, I can represent each restaurant with a single-symbol pin graphic. With a little help from digital maps, I’ve went from having a list of restaurants to seeing where I’ll be eating dinner tonight.
GIS
So that was a fun example, but I don’t exactly have a “do it yourself” cartographer’s kit in my basement. How can I do analysis like that? Here’s the jist, it’s GIS! (Homonym jokes work better when said out loud)
WHAT’S A GIS?
GIS stands for Geographic Information System, and it encompasses any system that can store, manipulate, and display digital map data. The goal of GIS is to use computers to answer geographic questions and solve geographic problems.
GIS DATA
Geospatial data is composed of a number of interacting files. These files include database information, metadata, projection information, images, and other types of spatial and attribute data. Spatial data is the geometry that explains where the feature is located on earth, and attribute data is additional information about the feature. GIS software uses special file managers, like ESRI’s ArcCatalog, to access and manage these groups of files
Almost everyone has seen or worked with attribute data before. It’s simply records within an excel table or a database. But when that data record can be tied to a location, spatial data comes into the mix. Spatial data can either be in raster or vector format.
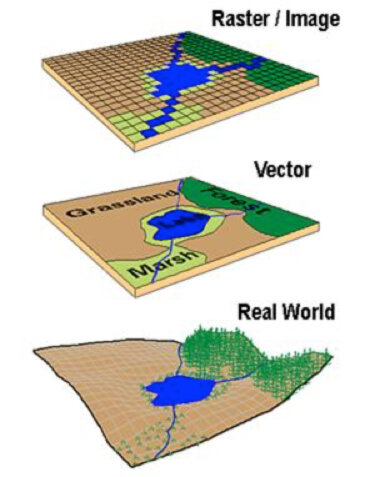
RASTER DATA
Raster data includes images such as satellite pictures or Ariel photography. Raster images are pixel based and have a fixed resolution, and therefore have limited use in dynamic, electronic maps. They are typically only used as a base image or a symbol.
VECTOR DATA
Vector data are points, lines, and polygons that are drawn to represent physical features or locations. A point is a specific point on a map, and might represent a city, a park, or any singular entity. Lines depict roads, natural borders, and other linear entities, and polygons enclose areas that share particular attributes. For example, a polygon would be used to mark a particular demographic within a city, or outline and color a county that voted democratic in the last election.
DATA DRIVEN VISUALIZATIONS
One of the most powerful features of electronic maps are that they are data driven. You create styling rules for how the map is to present data, and the map updates itself as you update the data. This gives maps the capability to provide real time visualizations
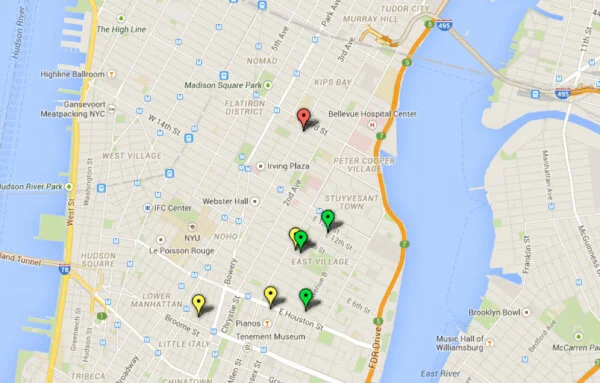
We made significant progress on our problem from the “Digital Maps” section, where we identified restaurants of interest on a map of NYC. But GIS is a lot more than putting points on a map. What if we want to go to a restaurant tonight that is also well rated by the community? (In-laws visiting for the weekend). Instead of having each restaurant represented by the same symbol, we can change the color based on the average customer rating for the restaurant. In this example, ratings of 3.8/5 and below are red, between 3.8 – 4.1 are yellow, and above 4.1 are green. While this data was already part of the map, we can now use it immediately in our decision making now that it is part of the visualization.
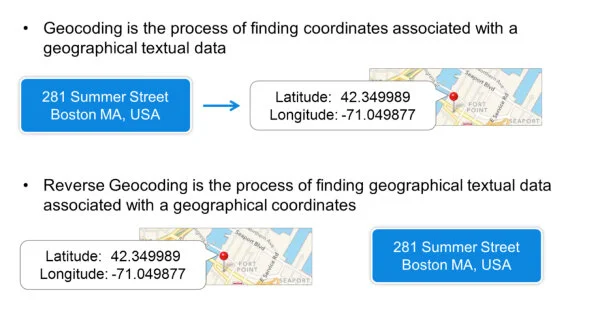
GEOCODING
Remember how we magically went from a textual address to latitude/longitude coordinates in the electronic maps example? That was geocoding. Geocoding is the key to using data within a GIS, as it converts the location component of data to a common format that the GIS can consume.
HOW TO USE GIS
Leveraging GIS is more than figuring out how to put some points on a map. GIS analysis follows a framework of steps: Ask, Acquire, Examine, Analyze, and Act.
ASK
What is the geographic question you are trying to answer?
ACQUIRE
Find the relevant data with the proper geographic scope.
EXAMINE
Validate the data’s source, accuracy, and completeness.
ANALYZE
Use GIS software tools to perform analysis. Maps make it far easier medium to identify patterns and clusters, then using a spreadsheet or database. Common analyses include:
Proximity – “What’s nearby?”
Classification – “Which features fit this pattern?”
ACT
Review and share your analysis to gain insight and make better decisions.
Congratulations! You should now have a high-level understanding of what geospatial, digital maps, and GIS are and how they work together to answer geographic questions. For some examples of how geospatial analysis can benefit your business, check out some business cases.
RESOURCES
Enjoy some of the finest geospatial educational resources on the web
Articles
Videos
E-Courses